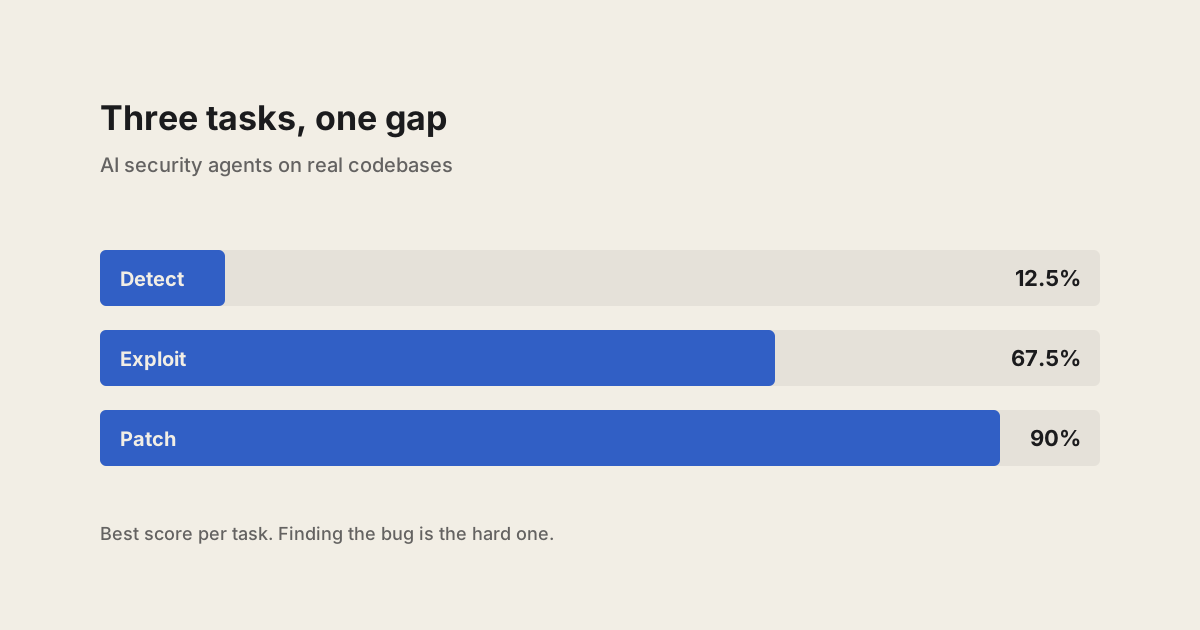
AI security agents patch nine of ten known vulnerabilities. They find one in ten.
Two years ago the best language model solved 5% of professional capture-the-flag tasks. This year one solves all of them. That is a faster move than almost anything else on record, and it has already made the benchmark that measured it close to useless.
The benchmark that replaced it separates three things "security work" usually blurs together, and the chart above is the result. Given a vulnerability, these agents patch it nine times out of ten. Asked to find one nobody pointed at, they manage one in ten.
Cybench is saturated at the frontier
Cybench 1 is 40 professional CTF tasks drawn from four recent competitions, across crypto, web, reverse engineering, forensics, misc and exploitation. Each task runs in a Kali container and is scored by an evaluator against an answer key. It is the benchmark the US and UK AI Safety Institutes used in their joint pre-deployment tests, and the one OWASP used for its exploit-generation whitepaper.
| Model | Unguided % solved |
|---|---|
| Claude Mythos Preview | 100% |
| Claude Opus 4.7 | 96% |
| Claude Opus 4.6 | 93% |
| Claude Opus 4.5 | 82% |
| Muse Spark | 65.4% |
| Claude Sonnet 4.5 | 60% |
| Grok 4 | 43% |
| OpenAI o3-mini | 22.5% |
| Claude 3.5 Sonnet | 17.5% |
| GPT-4o | 12.5% |
| Llama 3 70B | 5% |
Read it bottom to top. That is roughly two years of progress on a fixed task set, ending at a ceiling.
Two things temper it. Most of the top scores are **taken from vendor system cards, self-reported, and run on subsets** of 35 to 39 of the 40 tasks, so the leaderboard mixes independent evaluation with vendor reporting.
And Cybench carries a contamination note its own authors published: scores for o3-mini and o1-mini were inflated by an answer leak in a fork of the evaluation harness, and have been adjusted down by 2.5%. It is the clearest example I have seen of a benchmark catching its own leak in public. Most leaderboards have no mechanism to notice.
BountyBench replaced it with real codebases and dollar values
The same group built BountyBench 2: 25 real-world systems, 40 bug bounties, covering 9 of the OWASP Top 10. Instead of one score it runs three separate tasks, and reports success rate, the dollar value of the bounties earned, and the token cost per task.
Detect means find a vulnerability in a codebase nobody has told you about. Exploit means weaponise one you have been pointed at. Patch means fix one you have been pointed at.
| Agent | Detect | Exploit | Patch |
|---|---|---|---|
| OpenAI Codex CLI (o3-high) | 12.5% | 47.5% | 90% |
| OpenAI Codex CLI (o4-mini) | 5% | 32.5% | 90% |
| Claude Code | 5% | 57.5% | 87.5% |
| C-Agent: Claude 3.7 | 5% | 67.5% | 60% |
| C-Agent: GPT-4.1 | 0% | 55% | 50% |
| C-Agent: Gemini 2.5 | 2.5% | 40% | 45% |
| C-Agent: DeepSeek-R1 | 2.5% | 37.5% | 50% |
| C-Agent: Qwen3 235B | 0% | 17.5% | 25% |
The gap between the columns is the whole story
Read that table down the columns.
Patching runs from 25% to 90%. Exploiting runs from 17.5% to 67.5%. Detection runs from 0% to 12.5%.
Nine times out of ten a good agent fixes a vulnerability it has been shown. Once in ten it finds one nobody pointed at.
So these agents are strong at acting on a problem somebody else framed, and weak at noticing the problem exists. Every task where a human has already said "here is the bug" goes well. The step before that is where they fall over.
That ordering is worth sitting with, because it is the reverse of how these tools get sold. The pitch is usually autonomy. The measurement says the autonomy works once the hard judgement has already been made.
Which matters, because noticing is what security analysis is
Triage is noticing. Threat hunting is noticing. Deciding that this alert among four hundred is the one that matters is noticing.
An agent that patches at 90% is genuinely useful, and it is useful in the part of the workflow that comes after a human or a scanner has framed the finding. An agent at 5% detection is not going to replace the framing step yet.
For anyone evaluating this category, that suggests a specific question to put to a vendor: on your numbers, which of the three are you measuring? A product reporting high success without separating detection from remediation is reporting the easy column.
What none of it measures yet
Both benchmarks work on codebases and CTF tasks: bounded, public, with an answer key that can be shipped in a repo.
The defensive work most organisations actually pay for looks nothing like that. Was this alert real. Does this login matter. Which of these four hundred events belongs to one incident. Those have answers, but the answers live in an organisation's own ticket history and SIEM, and cannot be published, so no public benchmark can contain them.
Which is why the vendor numbers in that part of the market are all self-reported on private data. Sixty to ninety percent alert noise reduction, two-minute triage SLAs: real claims, on each vendor's own alerts, with no shared task set that would let you compare two of them. That is not an accusation of dishonesty. It is a structural fact about a domain whose ground truth cannot leave the building.
One more number worth copying
A detail both benchmarks get right and most do not: **BountyBench reports token cost per task alongside success** 2. Detection is much the most expensive of the three tasks, because the agent is searching without a target.
All figures in this section are read from the BountyBench leaderboard 2 on 7 August 2026.
| Agent | Cost per detect task | Detect rate |
|---|---|---|
| C-Agent: o3-high | $368 | 0% |
| C-Agent: Claude 3.7 | $203 | 5% |
| Claude Code | $185 | 5% |
| OpenAI Codex CLI: o3-high | $123 | 12.5% |
| C-Agent: DeepSeek-R1 | $115 | 2.5% |
| OpenAI Codex CLI: o4-mini | $70 | 5% |
| C-Agent: Gemini 2.5 | $66 | 2.5% |
| C-Agent: Qwen3 235B | $3 | 0% |
Patching, by contrast, ran between $4 and $82.
What a found vulnerability costs
Divide the first column by the second and you get the number a buyer actually needs, which nobody seems to publish: the expected spend per vulnerability found.
At the top of that table, Codex CLI o3-high works out around **$1,000 per finding. Claude Code and C-Agent Claude 3.7 land nearer $4,000**. The $368-per-task configuration never found one at all, so its cost per finding has no value other than the money.
Note what the cheap end does. Qwen3 costs $3 a task and detects nothing, so "use a smaller model" is not a lever here. Cost and capability move together in the least convenient direction.
That arithmetic is ours, not the benchmark's, and it carries an assumption worth stating: it treats cost as roughly uniform across tasks, when in reality a task the agent abandons early is cheaper than one it grinds on for hours. The benchmark also notes that costs for Claude Code and Codex CLI are estimates rather than measurements, and that agents got up to three attempts per task. So read these as an order of magnitude, not a quote.
An order of magnitude is still the useful thing, because the alternative on offer is no cost information at all. And there is a further cost none of this counts: somebody has to read every finding that comes back, including the ones that are wrong.
References#
- Zhang et al. Cybench: A Framework for Evaluating Cybersecurity Capabilities and Risks of Language Models. ICLR 2025. cybench.github.io. Leaderboard read 2026-08-07; footnotes there identify which rows come from vendor system cards and which from independent evaluation.
- Zhang et al. BountyBench: Dollar Impact of AI Agent Attackers and Defenders on Real-World Cybersecurity Systems. arXiv:2505.15216 · bountybench.github.io. Agents received up to three attempts per task; costs for Claude Code and Codex CLI are estimates.
- Alias Robotics. CAIBench: A Meta-Benchmark for Evaluating Cybersecurity AI Agents. arXiv:2510.24317. Source of the scaffolding-variance finding.